Design
-
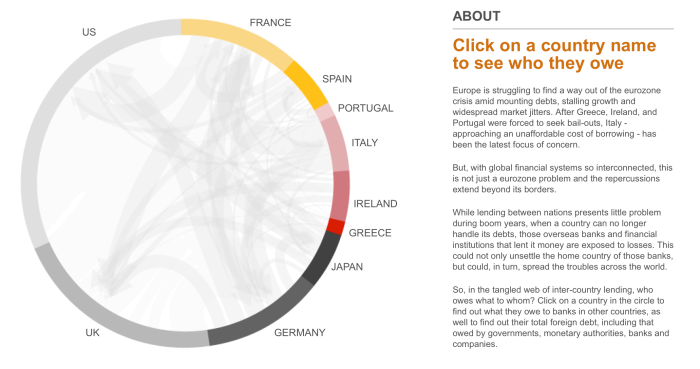
Understanding the global money markets
Two striking visualisations — a BBC diagram of European sovereign debt entanglements and an xkcd infographic on the scale of global money — that help make the staggering complexity of the financial system legible.
-
Permaculture and online learning
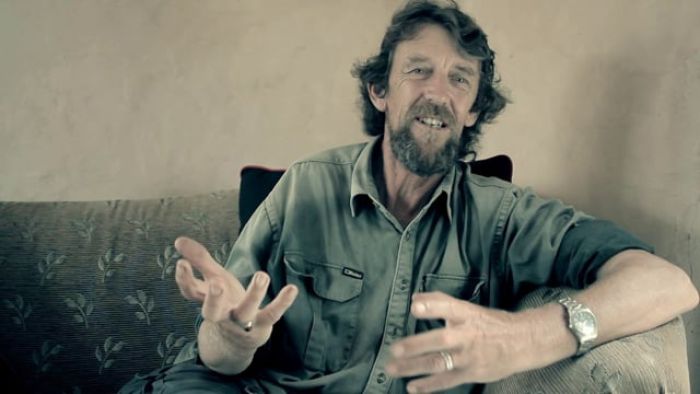
After years of exposure to Permaculture and having spent several years a decade ago implementing a disparate set of its common patterns at our previous property in Northern NSW, I am now taking a much deeper dive into it after enrolling in Geoff Lawton's Online Permaculture Design Course.
-
Permaculture Online Course Update
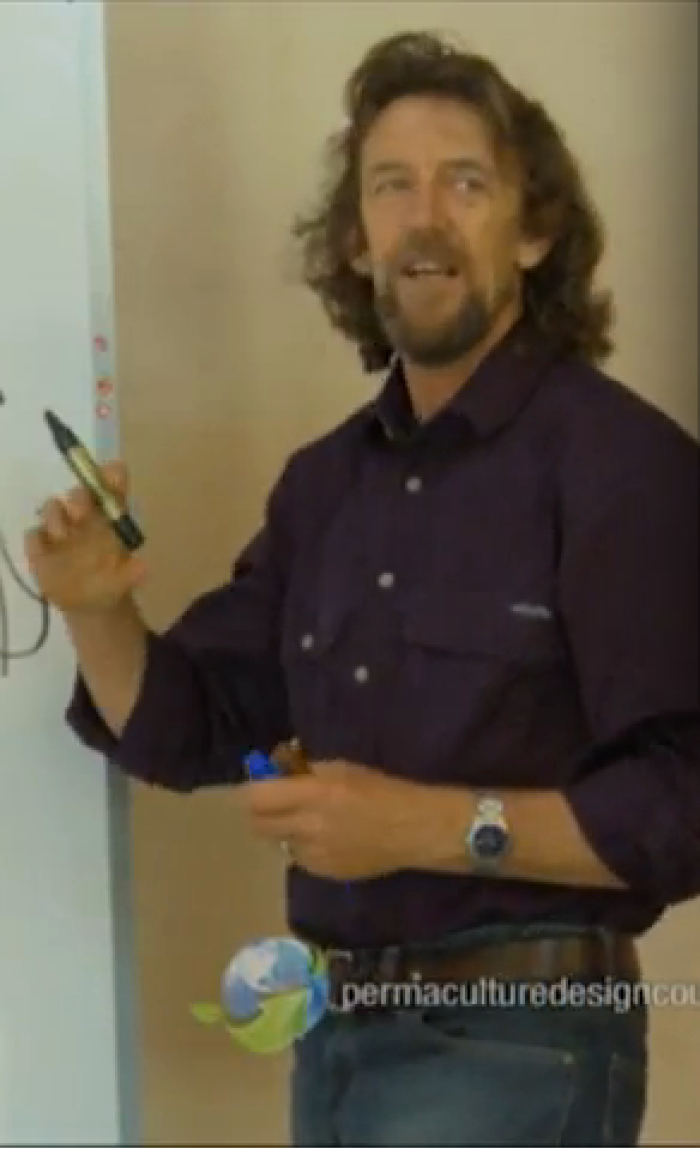
In a previous post I wrote about the positive experience we were having taking part in Geoff Lawton's Online Permaculture course. Having completed all the online lessons and the quiz we are now working on the practical assignment which is due by the end of August.
-
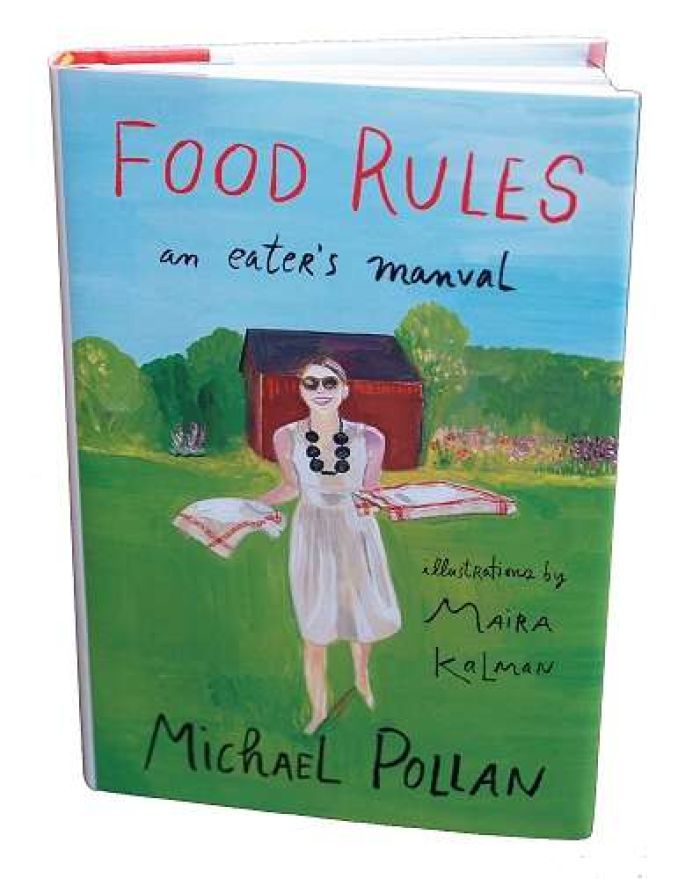
Ode to invention, Maira Kalman
Maira Kalman's graphic celebration of Benjamin Franklin's inventiveness, part of her year-long NY Times series exploring American history and democracy. A gateway to her wider work, including a beautifully illustrated edition of Michael Pollan's Food Rules.
-
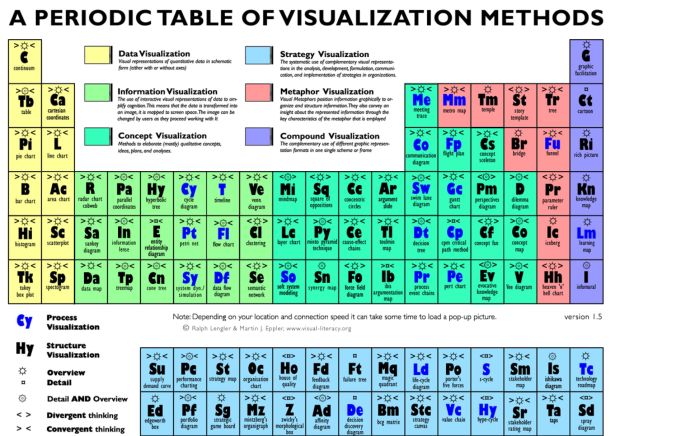
Visualisation techniques
A link to an interactive periodic table of data visualisation techniques — a broad and surprising compilation, with many methods you won't have encountered before.
-
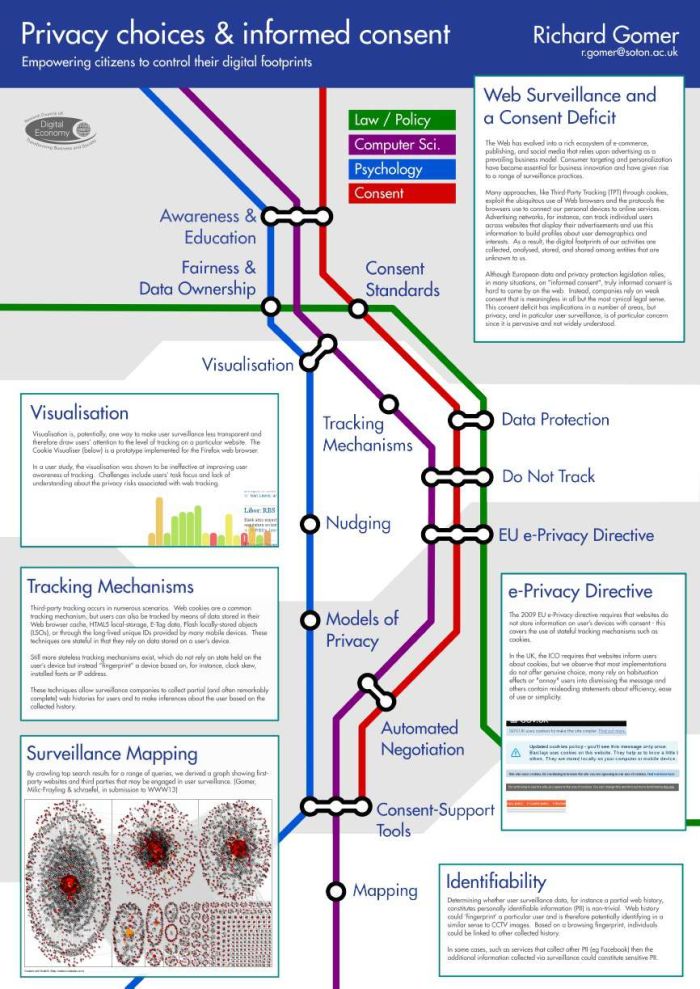
Information Visualisation and Web Science
Very interesting diagrams to see at the Web Science Industry Forum Poster Session via Mark Bernstein.
-
Balehaus - an experimental building
Bath University's Balehaus project uses prefabricated straw-filled wall panels to create a high-performance prototype building — a promising demonstration of locally sourced, low-impact construction materials that raises the question of when such approaches might reach Australia.
-
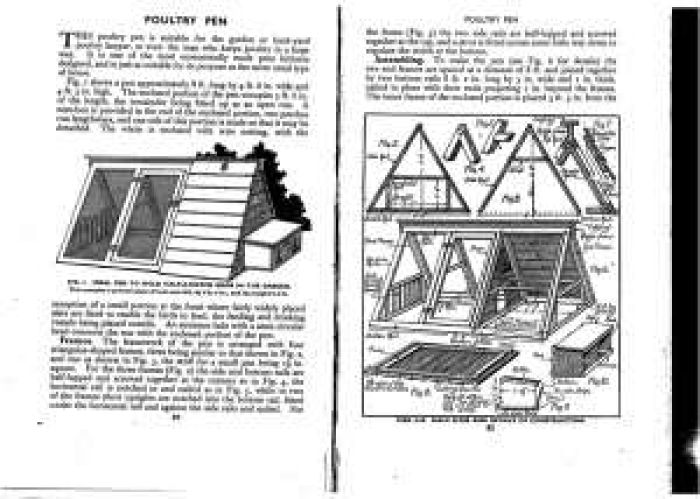
Traditional chicken ark
Plans for a traditional chicken ark drawn from Charles Hayward's 1940 book Carpentry for Beginners — still a valuable hand-tool reference. A practical design for a movable poultry shelter, with a link to the full PDF.
-
More on chicken tractors
Since my post about chickens which mentioned the Linda Woodrow inspired chook dome. I have noticed that people are searching in google for information about chicken tractors.
-
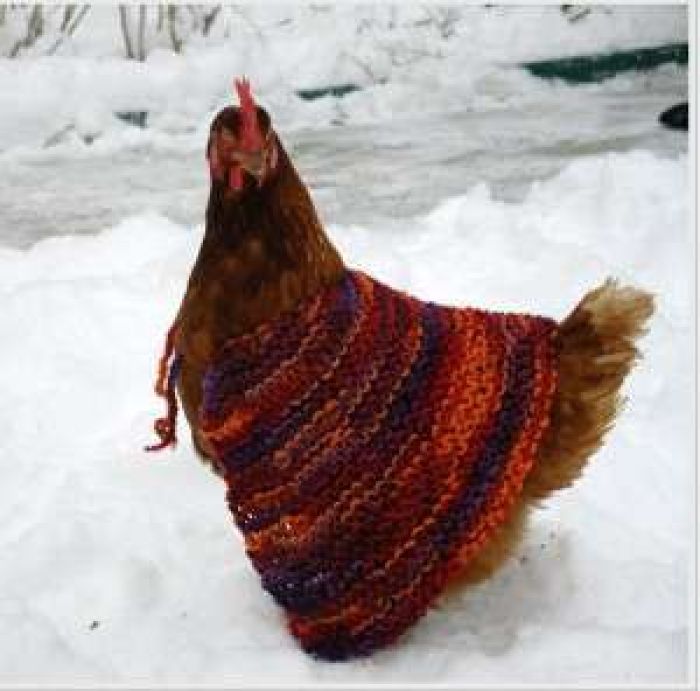
Chilly chook
While browsing the website of designer Zach Debord I came across this great picture of a chook in the snow with a jumper on, she looks very cosy.